Our first Oral Presentation will be an All About Me Project.
Using Infographics to Display Information
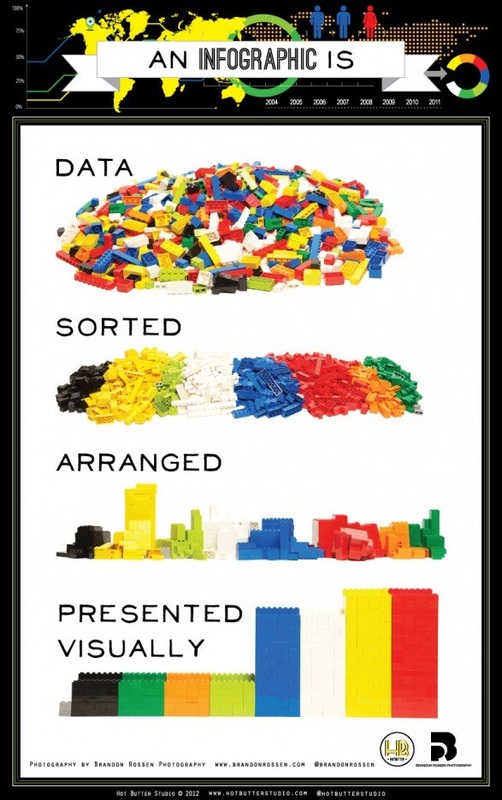
What is an Infographic?
Information graphics or infographics are visual representations of information, data or knowledge. These graphics are used where complex information needs to be explained quickly and clearly, such as in signs, maps, journalism, technical writing, and education. They are also used extensively as tools by computer scientists, mathematicians, and statisticians to ease the process of developing and communicating conceptual information.
Infographics are traditionally viewed as visual elements such as signs, charts, maps, or diagrams that aid comprehension of a given text-based content. Often more powerful than words or imagery alone, infographics utilize visual elements of design and words to convey a message in such a way that context, meaning and understanding are transcended to the observer in a manner not previously experienced. However, visual representation of information can be more than just the manner in which we are able to record what has been discovered by other means. They have the potential to become the process by which we can discern new meaning and discover new knowledge. The observer becomes enlighten, having learned from the visual feast and is motivated to seek out more knowledge in this medium.
Infographics as a Creative Assessment
Infographics are a visual representation of data. When students create infographics, they are using information, visual, and technology literacies. This page includes links to help you develop formative or summative assessments that have students creating infographics to showcase their mastery of knowledge.